No-build games & apps
Creations tagged no-build on 8x — every one is playable in the browser and open to remix.
192 creations · page 3 / 8

Fluxboard- сигnal observatory for pasted feeds
Paste any CSV or JSON feed and Fluxboard autodetects its shape — time-series, category breakdown, or numeric scatter — then renders a live, fully adjustable multi-chart dashboard with stat tiles and a signal readout. Clean, dependency-free, and built to be remixed: every palette, threshold, and copy string lives in one config block.

Sift — Pasted-Feed Data Board
Sift turns any pasted CSV, TSV or JSON feed into a living, re-themeable data board. Paste in your data and it auto-detects the shape, classifies columns (numeric/date/text), and builds a summary of stat tiles, an explorable main chart (bar/line/pie/radar/scatter), a distribution view, and a sortable data table — all with no build step. Everything a remixer wants to change is tucked into config.js: name, tagline, palette and sample feeds.

FLUXGRID
Paste any CSV, TSV, or JSON feed and FLUXGRID auto-detects the columns, computes live statistics, and renders the data as bar, line, or donut charts on a canvas — all in your browser with no build step. Tune the theme, brand, or demo data from one config file.

GridLens — Paste a feed, see the story
GridLens turns any pasted CSV, TSV or JSON feed into a live data dashboard. It auto-detects delimiters and column types, then renders stat tiles plus an explorable trend, compare and share chart suite — no build step, no upload, all in the browser.

Meridian — Remixable Data Console
Meridian is a no-build data console: paste a CSV or JSON feed, let it auto-detect the format and map your fields, then read the signal as stat tiles plus bar, trend and share charts. Every value is tunable in one config so it is built to remix, and you can export the headline numbers as a shareable PNG.
 Rajasthan Jangid220
Fluxboard — Paste-to-insights data dashboard
Fluxboard turns any pasted CSV or JSON feed into a live analytics dashboard. It auto-detects columns and value types, then renders KPI tiles plus a grouped bar chart, a trend line, a share donut and a sortable table — all dependency-free and driven by a single config so it's easy to remix.

Refract — a remixable data atlas
Paste raw CSV or JSON in the box and Refract auto-infers column types, then builds a living analytics page — stat tiles, a touch-friendly canvas chart (shared line, horizontal bars, or donut), field-type badges, and a record table. Remixable: labels, palette, and two themed sample feeds all live in one config file.
 True Falcon212
Photo Shining ✨ ಫೋಟೋ ಶೈನಿಂಗ್
ಫೋಟೋ ಶೈನಿಂಗ್ — a 100% client-side photo shine studio. Upload any image (or use the demo) and layer on sparkling gold stars, dreamy glow bloom, soft bokeh, lens flare and a moving gloss sweep — each with adjustable intensity — then export the enhanced photo as PNG. Everything runs offline in your browser; your photo never leaves your device.

FATHOM — paste-a-feed data dashboard
FATHOM turns a pasted CSV or JSON feed into a live data deck. It autodetects the shape, then renders stat tiles, a trend line, category bars, a share donut and sparklines on crisp canvas — no build step, fully remixable.

FeedSpark — Paste-to-Dashboard
FeedSpark turns any pasted CSV, TSV, or JSON feed into an instant interactive dashboard — bar/line/pie/doughnut/radar/scatter charts, distribution histograms, Pearson correlation analysis, per-column stats, and a searchable/sortable data table with CSV export. Ships with 6 fresh sample feeds (esports, weather, books, EV charging, box office, crowdfunding) on a midnight-aurora theme. Fully remixable no-build static app.

Signalfeed — paste a feed, get a dashboard
Signalfeed turns a pasted CSV or JSON feed into an instant dashboard: stat tiles, canvas line/bar/scatter charts with touch tooltips, and a raw-row table. Delimiters, headers and column types are auto-detected; everything runs in your browser, nothing is uploaded, and your last paste survives reload. Fully remixable — palette, copy, chart defaults and the demo feed all live in one config file.

DataScope — Paste-to-Dashboard
Paste any CSV, TSV, or JSON feed to instantly explore your data: interactive charts (bar, line, pie, doughnut, radar, scatter), distribution histograms, Pearson correlation analysis, per-column summary stats, and a searchable/sortable data table with PNG export. Ships with 6 themed sample datasets (box office, crypto, football, books, streaming, food delivery). Fully remixable no-build static app.

DUEL ARCADE
DUEL ARCADE is a local 2-player versus hub with three minigames on one screen: CHOR POLICE (chase & tag), SHOOTING DUEL (blast & dodge), and PING PONG (reflex rally). Each match is first to 5, with juicy screen shake, hit-stop, particles and synth SFX. Works on any screen — keyboard on desktop, on-screen touch pads on mobile, portrait or landscape.

Patchwork — Tableau de données remixable
Patchwork assemble un collage de données brutes (CSV, TSV, point-virgule, pipe, JSON, fragments) en un tableau remixable : reconnaissance automatique des colonnes, tri, filtrage, masquage et réordonnancement, édition en ligne, statistiques et graphiques SVG (barres, courbe, anneau). Palette et configuration partageables par lien remix.

PulseView — Remixable Data Dashboard
PulseView turns any pasted CSV, TSV, or JSON feed into an instant analytics dashboard. Explore your data with six interactive chart types (bar, line, pie, doughnut, radar, scatter), a distribution histogram, Pearson correlation analysis, per-column summary stats, and a searchable/sortable table with CSV and PNG export. Ships with six sample datasets to explore right away — a fully remixable no-build static app.
 Sarvan Kumar160
CITY CHASE — Chor Police
A fast, juicy 2-player (or vs-AI) Chor-vs-Police rooftop chase. The red Chor steals golden loot and must deliver it to a glowing green drop zone to score; the blue Police must catch the Chor to score. First to 5 wins. Runs on any screen — keyboard on desktop, on-screen touch pads on mobile, with camera shake, hit-stop and particle effects.

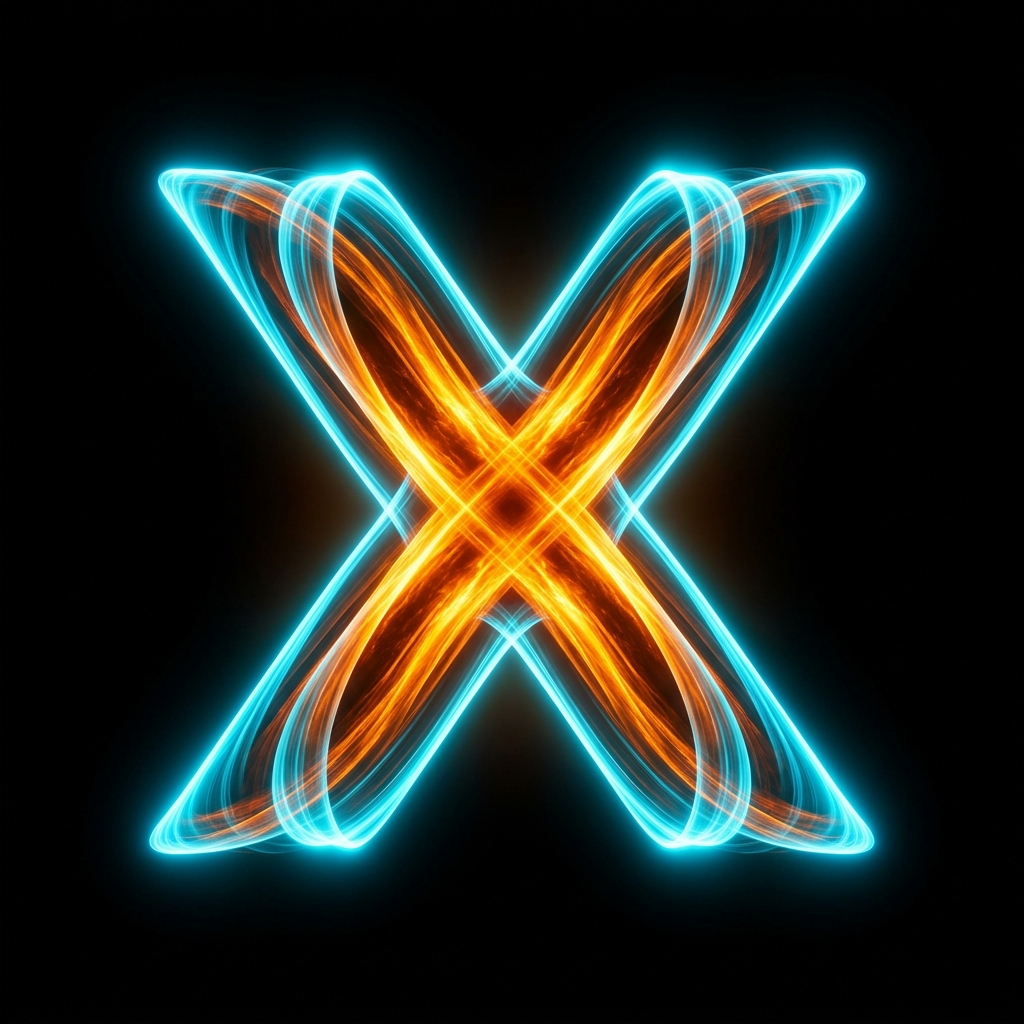
Orbital Bloom
A generative art toy that weaves luminous strands through a curl-noise flow field. Tune the seed, palette, strand count, trail length and field scale live, then export a perfectly seamless looping WebM or a high-res PNG still. Every artwork is reproducible from its seed.

Feedweave
Feedweave turns a pasted CSV, TSV, or JSON feed into a remixable dashboard — it autodetects the schema, builds summarizing stat tiles, and draws crisp bar, line, and donut charts on canvas. Every color, font, default, and the sample feed live in one config file, so the whole thing can be re-themed or re-skinned by editing a few constants.
 रतन Sadya150
👑 Le Royaume d'Otaku
Base multijoueur du royaume des quiz. Inscription/connexion, profil avec avatar anime unique généré en SVG, présence en ligne réellement synchronisée en temps réel, recherche de joueurs par pseudo, création/adhésion à des groupes et visualisation des membres en ligne. Ambiance anime/manga dans un monde fantastique royal. Prêt pour les quiz, XP et combats de groupes à venir.
 Fana Touré141
TURBOT MOST WANTED
Tilt your phone to swing a wheeled rudder-boat down a Bikini Bottom reef highway: weave through rival fish-boats, grab Krabby Patties and bubble nitro, and hold your line to outrun the squid PD before your HEAT bar hits 100. Three selectable rudders each change how the boat turns, and your best score is saved locally.

PIP — your little talking robot
PIP is a pocket robot pal that genuinely talks out loud. Type a message or tap the mic and PIP chats back, tells jokes, does quick math, reads the time and keeps you company — all with a friendly animated face and a robot voice powered by your browser's built-in speech engine. Works in portrait or landscape, no backend, fully client-side.
 Sky d blessed19515
PivotPrism
Paste any CSV or JSON feed and PivotPrism auto-detects the shape, summarizes it into live stat tiles, and renders Line, Bar, Donut, and Scatter charts on a crisp canvas — all in-browser, nothing leaves the page. Retheme the palette and retune the parser or sample data by editing config.js.
 Hikmat Darajat132
Pivotary — remixable data dashboard
Paste any CSV, TSV, JSON or JSON Lines feed and Pivotary auto-detects its shape, computes live statistics, writes a plain-language discovery narrative, and renders bar, line, scatter and histogram charts on canvas — plus a branded PNG stat card for sharing. No build step, and every color, threshold and sample feed is tunable from one config file so it's easy to remix.

ಫೋಟೋ ಶೈನಿಂಗ್ — Photo Shining
ಫೋಟೋ ಶೈನಿಂಗ್ / Photo Shining invites you to upload a photo and make it shine — add adjustable twinkling sparkles, a soft glow bloom, dreamy bokeh circles, a lens flare and a moving gloss sweep, all previewed live and rendered 100% in your browser. Export the finished image as a high-res PNG; nothing ever leaves your device.